Frontex and deportations, 2006-21
12 January 2023
Data covering 16 years of Frontex’s deportation operations shows the expanding role of the agency. We have produced a series of data visualisations to show the number of people deported in Frontex-coordinated operations, the member states involved, the destination states, and the costs.

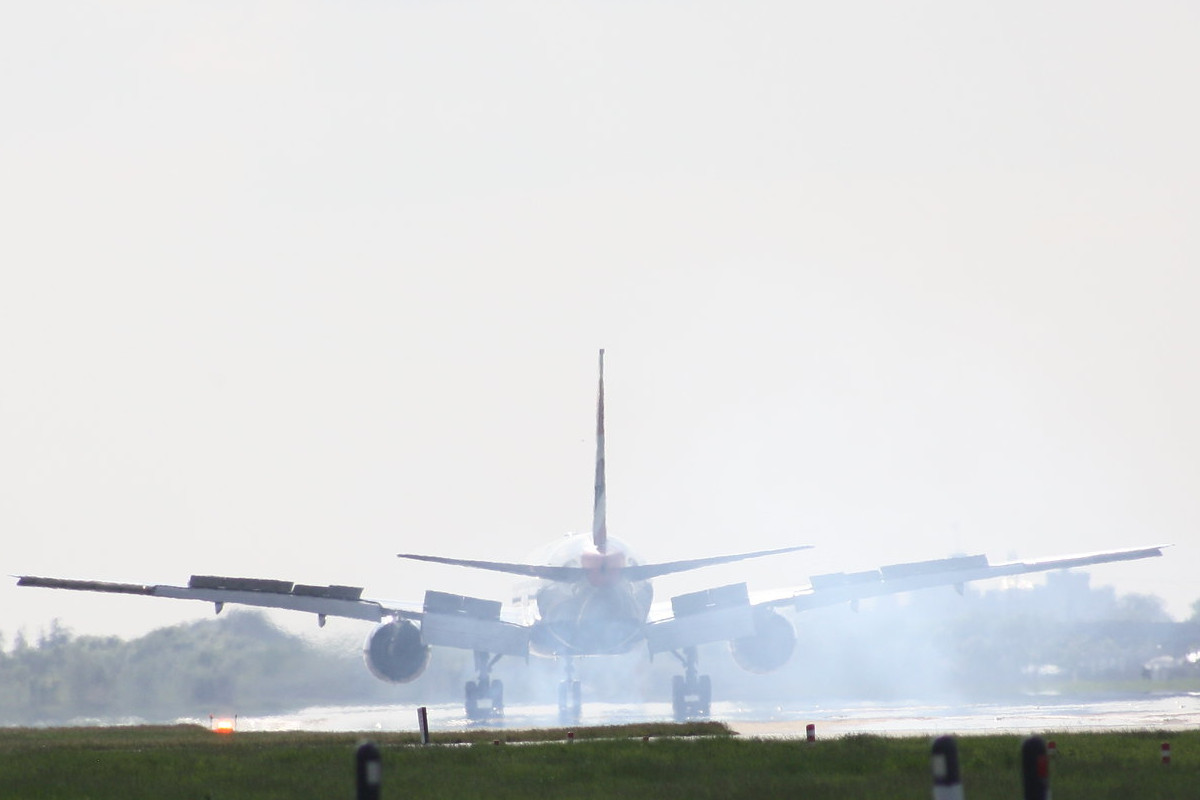
Image: Jason Peper, CC BY-SA 2.0
Updated figures (covering the period 2006-2022) are available here.
In August 2020 we published the report Deportation Union, to provide a critical examination of EU measures designed to increase the number of deportations carried out by national authorities and the European Border and Coast Guard Agency, Frontex. The report focuses on three key areas: attempts to reduce or eliminate rights and protections in the law governing deportations; the expansion and interconnection of EU databases and information systems; and the increased budget, powers and personnel awarded to Frontex. The infographics and data here build upon data compiled for that report, covering the period from 2006 to 2021.
Data collection (via access to documents requests), compilation and visualisations by Ida Flik.
Deporting states and destination states
This graphic provides a visual representation of the 15 EU member states most invested in Frontex’s deportation operations, and the 15 most popular destinations for those operations. Germany is by far and away the biggest user of Frontex’s services, and Albania is the primary destination for Frontex-coordinated deportations.
Deportations by year, EU member states and destination states
This graphic makes it possible to examine in more detail the member states involved in Frontex-coordinated deportations to particular destinations. For example: Germany is the only state to have deported anyone to Azerbaijan via a Frontex-coordinated operation since 2019; it is also the only EU member state to have deported anyone to Bosnia via a Frontex coordinated operation since 2018.
Frontex’s financial contributions to member states
Member states can claim back from Frontex the costs they incur for participating in deportation operations coordinated by the agency. This graphic shows how much each participating member state has received each year. As the biggest user of Frontex-coordinated deportation operations, Germany is also by far the biggest recipient of these funds. The total it received in 2021 (more than €24.6 million) is almost as high as the figure for 2019, when it received more than €26.1 million.
Costs per deportee by destination state
The financial cost of deporting somebody differs depending on the destination state, as shown in this chart. Ethiopia is by far the most expensive destination, with the cost to remove one person to the east African state coming in at over €42,000. The next state in the list, Gambia, is less than half the cost. The average cost per deportee across all destinations is €3,670.
Number of operations and people deported, by year and operation type
This chart shows the number of people deported and the number of deportation operations, by year and operation type. For joint return operations (JROs), Frontex coordinates the actions of multiple member states who wish to deport people to one or more destinations. National return operations involve just one EU member state, but Frontex nevertheless plays a coordinating and financing role. Collecting return operations involve a plane and staff from the destination state travelling to the EU to pick up deportees.
Spotted an error? If you've spotted a problem with this page, just click once to let us know.